Market Outlook
December 22, 2017
Market Cues
Domestic Indices
Chg (%)
(Pts)
(Close)
Indian markets are likely to open flat tracking global indices and SGX Nifty.
BSE Sensex
(0.1)
(21)
33,756
Following the lackluster performance seen in the previous session, US markets saw
Nifty
(0.0)
(4)
10,440
modest strength on Thursday. The major averages all moved to the upside, although
Mid Cap
0.8
135
17,554
buying interest was somewhat subdued. The major averages closed in positive
Small Cap
1.1
207
18,881
territory but well off their highs of the session. The Dow climbed 0.2 percent to
Bankex
(0.3)
(75)
28,881
24,782, the Nasdaq edged up 0.1 percent to 6,965 and the S&P 500 rose 0.2
percent to 2,685.
Global Indices
Chg (%)
(Pts)
(Close)
The U.K. stocks leapt to a record close Thursday, with gains for multinationals
helping the blue-chips benchmark overcome a sluggish start marked by gloomy
Dow Jones
0.2
56
24,782
updates about British consumer confidence and private consumption. The FTSE 100
Nasdaq
0.1
4
6,965
index jumped 1% to settle at record close of 7,602.
FTSE
1.0
79
7,604
Nikkei
(0.1)
(26)
22,866
Indian benchmark indices ended flat on Thursday after a choppy session following
muted reaction of the Asian markets to the passage of US tax cuts. Meanwhile bonds
Hang Seng
0.5
133
29,367
were spooked by the blowout in government debt needed to fund the giveaways.
Shanghai Com
0.4
12
3,300
The 10-year bond yield on Thursday hit fresh 17-month high after the RBI minutes
showed that all members of rate setting committee were worried due inflation and
Advances / Declines
BSE
NSE
an uncertain growth. BSE Sensex closed lower 0.1%, to 33,756, while the Nifty 50
Advances
1,695
1,118
declined 0.15%, to close at 10,429.
Declines
1,041
645
News Analysis
Unchanged
177
62
Maruti commissions an EV feasibility study
Detailed analysis on Pg2
Volumes (` Cr)
BSE
6,147
Investor’s Ready Reckoner
NSE
32,518
Key Domestic & Global Indicators
Stock Watch: Latest investment recommendations on 150+ stocks
Net Inflows (` Cr)
Net
Mtd
Ytd
Refer Pg5 onwards
FII
(1,446)
(5,389)
52,243
Top Picks
*MFs
(885)
4,449
114,687
CMP
Target
Upside
Company
Sector
Rating
(`)
(`)
(%)
Blue Star
Capital Goods Accumulate
800
867
8.4
Top Gainers
Price (`)
Chg (%)
Dewan Housing Finance
Financials
Buy
601
712
18.6
Ifci
29
20.3
Asian Granito
Other
Accumulate
539
570
5.7
Manappuram
119
12.6
Navkar Corporation
Other
Buy
189
265
40.3
Unitech
8
11.9
KEI Industries
Capital Goods
Buy
357
436
22.3
More Top Picks on Pg4
Wockpharma
893
11.8
Adanitrans
225
10.0
Key Upcoming Events
Previous
Consensus
Date
Region
Event Description
Reading
Expectations
Top Losers
Price (`)
Chg (%)
Dec22
US
GDP Qoq (Annualised)
3.30
3.30
M&M
742
(3.7)
Dec22
US
New home sales
685.00
655.00
Den
110
(3.5)
Dec27
Germany PMI Manufacturing
63.30
63.30
Castrolind
203
(3.3)
Dec31
US
Consumer Confidence
129.50
128.00
Jan02
China
PMI Manufacturing
51.80
51.70
Balkrisind
1,212
(3.2)
More Events on Pg7
Mothersumi
373
(3.1)
As on December 21 2017
Market Outlook
December 22, 2017
News Analysis
Maruti commissions an EV feasibility study
Maruti Suzuki has commissioned a study to gauge the requirements of potential
consumers to bring an affordable electric vehicles by 2020. The study is likely to
be completed by the end of February paving the way for the introduction of the
MSIL's first EV, likely in 2020. Though the company, with its strong brand and
strong connect with the customers is expected to be key beneficiary even in the
EVs, the challenge remains in making a small and affordable electrical vehicle at
the moment. Company has said that localisation will play a crucial role in
reducing costs and increasing affordability hence its EV will have more local
content than the imported content. Company also expects some amount of
government intervention to promote widespread use of EV among consumers.
In November, Suzuki Motor Corporation (SMC) finalised an agreement with Toyota
Motor Corporation (TMC) to introduce EVs in India. Under the agreement, Toyota
will provide technical support while Suzuki will manufacture EV for the Indian
market and will also supply some vehicles to Toyota. Both the companies will also
undertake a study of activities like setting up of charging infrastructure, personnel
training, etc. for widespread acceptance and use of EVs in India.
MSIL expects about 40% of new personal vehicles sold in the local market could be
pure electric by 2030. Going by the MSIL’s expectations, we believe about 8-10mn
vehicles would be sold by 2030 and Maruti, with its current track record will be
holding 40-50% market share within that. This looks an interesting opportunity for
MSIL, however we still do not factor in the EV in MSIL’s price.
Economic and Political News
2G scam verdict : Special CBI court finds A. Raja not guilty
RBI’s monetary policy committee wary of fresh risks to inflation, minutes
show
2G verdict puts Modi and BJP's planning for 2019 in a very awkward spot
Corporate News
Adani Transmission signs agreement to buy Reliance Infra’s Mumbai biz
Gujarat Industries Power revokes merger with GIPCL Project
ABB India gets order worth Rs134 crore for Indian Railway
Suven Life Sciences gets product patents from Canada, India
Market Outlook
December 22, 2017
Top Picks HHHHH
Market Cap
CMP
Target
Upside
Company
Rationale
(` Cr)
(`)
(`)
(%)
Strong growth in domestic business due to its leade`hip
in acute therapeutic segment. Alkem expects to launch
Alkem Laboratories
25,932
2,169
2,341
7.9
more products in USA, which bodes for its international
business.
We expect the company would report strong profitability
Asian Granito
1,623
539
570
5.7
owing to better product mix, higher B2C sales and
amalgamation synergy.
Favorable outlook for the AC industry to augur well for
Cooling products business which is out pacing the
Blue Star
7,671
800
867
8.4
market growth. EMPPAC division's profitability to
improve once operating environment turns around.
With a focus on the low and medium income (LMI)
consumer segment, the company has increased its
Dewan Housing Finance
18,832
601
712
18.6
presence in tier-II & III cities where the growth
opportunity is immense.
Loan growth is likely to pick up after a sluggish FY17.
Lower credit cost will help in strong bottom-line growth.
Karur Vysya Bank
9,010
125
180
44.2
Increasing share of CASA will help in NIM
improvement.
High order book execution in EPC segment, rising B2C
KEI Industries
2,794
357
436
22.3
sales and higher exports to boost the revenues and
profitability
Expected to benefit from the lower capex requirement
Music Broadcast
2,170
380
434
14.1
and 15 year long radio broadcast licensing.
Massive capacity expansion along with rail advantage
Navkar Corporation
2,843
189
265
40.3
at ICD as well CFS augur well for the company
Strong brands and distribution network would boost
Siyaram Silk Mills
3,480
743
800
7.7
growth going ahead. Stock currently trades at an
inexpensive valuation.
Market leadership in Hindi news genre and no.
2
viewership ranking in English news genre, exit from the
TV Today Network
2,450
411
435
5.9
radio business, and anticipated growth in ad spends by
corporate to benefit the stock.
After GST, the company is expected to see higher
volumes along with improving product mix. The Gujarat
Maruti Suzuki
2,90,877
9,629
10,619
10.3
plant will also enable higher operating leverage which
will be margin accretive.
We expect loan book to grow at 24.3% over next two
GIC Housing
2,263
420
655
55.9
year; change in borrowing mix will help in NIM
improvement
We expect CPIL to report net Revenue/PAT CAGR of
~17%/16% over FY2017-20E mainly due to healthy
7,479
337
400
18.8
growth in plywood & lamination business, forayed into
Century Plyboards India
MDF & Particle boards on back of strong brand &
distribution network.
We expect sales/PAT to grow at 13.5%/20% over next
LT Foods
2,289
86
96
11.9
two years on the back of strong distribution network &
addition of new products in portfolio.
We expect sales/PAT to grow at 13%/16% over next two
years on the back of strong healthy demand in writing
Ruchira Papers
429
200
244
22.0
& printing paper and Kraft paper. Further, China had
banned making paper from waste pulp which would
benefit Indian paper companies.
Source: Company, Angel Research
Market Outlook
December 22, 2017
Key Upcoming Events
Global economic events release calendar
Bloomberg Data
Date
Time Country
Event Description
Unit
Period
Last Reported
Estimated
Dec 22, 2017
7:00 PMUS
GDP Qoq (Annualised)
% Change
3Q T
3.30
3.30
8:30 PMUS
New home sales
Thousands
Nov
685.00
655.00
Dec 27, 2017
2:25 PMGermany
PMI Manufacturing
Value
Dec F
63.30
63.30
Dec 31, 2017
8:30 PMUS
Consumer Confidence
S.A./ 1985=100
Dec
129.50
128.00
Jan 02, 2018
6:30 AMChina
PMI Manufacturing
Value
Dec
51.80
51.70
3:00 PMUK
PMI Manufacturing
Value
Dec
58.20
57.70
Jan 03, 2018
2:25 PMGermany
Unemployment change (000's)
Thousands
Dec
(18.00)
(13.00)
Jan 04, 2018
2:25 PMGermany
PMI Services
Value
Dec F
55.80
55.80
Jan 05, 2018
7:00 PMUS
Change in Nonfarm payrolls
Thousands
Dec
228.00
183.00
7:00 PMUS
Unemployment rate
%
Dec
4.10
4.00
Jan 10, 2018
3:00 PMUK
Industrial Production (YoY)
% Change
Nov
3.60
India
Imports YoY%
% Change
Dec
19.60
India
Exports YoY%
% Change
Dec
30.60
Jan 11, 2018
US
Producer Price Index (mom)
% Change
Dec
1.40
Jan 12, 2018
7:00 PMUS
Consumer price index (mom)
% Change
Dec
0.40
China
Exports YoY%
% Change
Dec
12.30
Jan 15, 2018
12:00 PMIndia
Monthly Wholesale Prices YoY%
% Change
Dec
3.93
Jan 16, 2018
3:00 PMUK
CPI (YoY)
% Change
Dec
3.10
Jan 17, 2018
3:30 PMEuro Zone
Euro-Zone CPI (YoY)
%
Dec F
1.50
7:45 PMUS
Industrial Production
%
Dec
0.20
Jan 18, 2018
7:00 PMUS
Housing Starts
Thousands
Dec
1,297.00
7:00 PMUS
Building permits
Thousands
Dec
1,298.00
Jan 24, 2018
8:30 PMUS
Existing home sales
Million
Dec
5.81
3:00 PMUK
Jobless claims change
% Change
Dec
5.90
Source: Bloomberg, Angel Research
Market Outlook
December 22, 2017
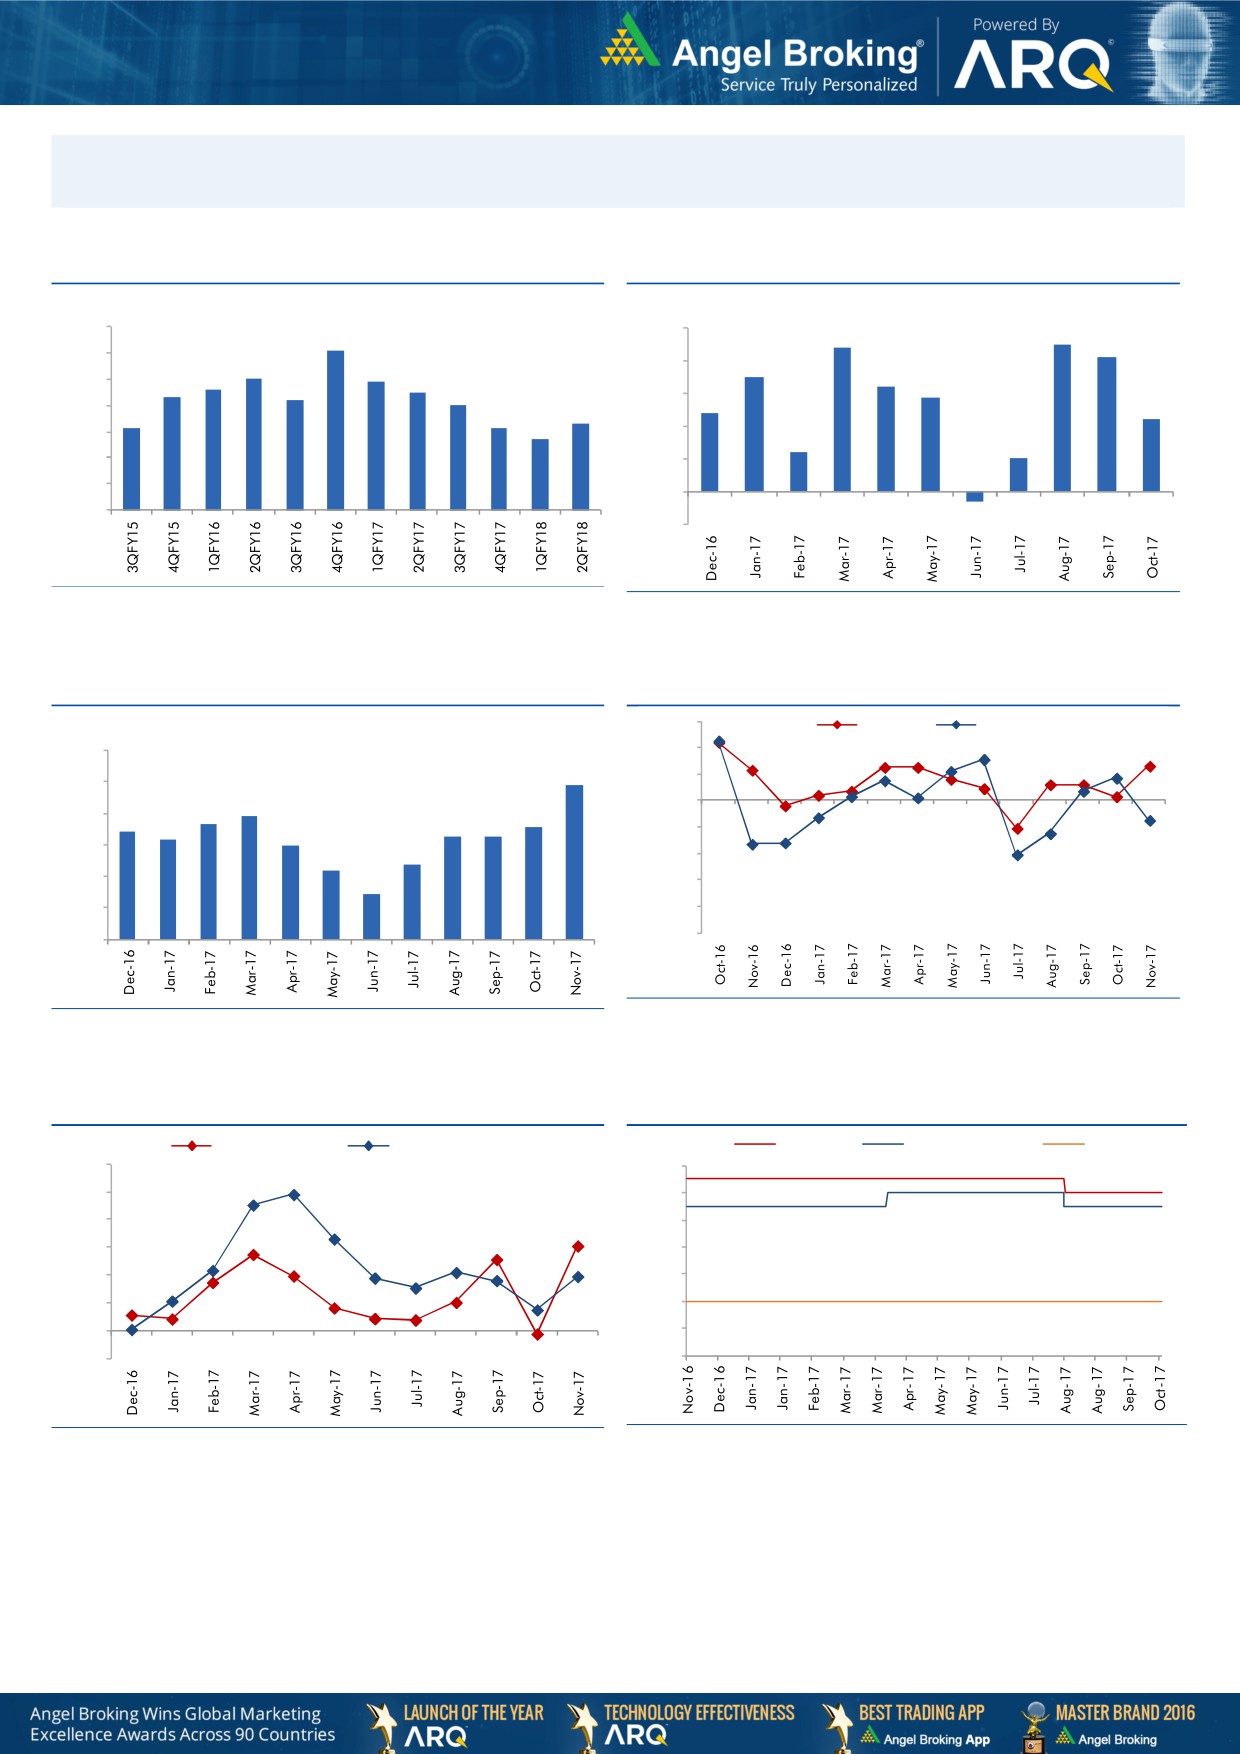
Macro watch
Exhibit 1: Quarterly GDP trends
Exhibit 2: IIP trends
(%)
(%)
10.0
5.0
4.5
9.1
4.4
4.1
9.0
8.0
7.9
4.0
3.5
7.6
7.5
3.2
8.0
7.3
7.2
2.9
7.0
3.0
2.4
7.0
6.3
2.2
6.1
6.1
5.7
2.0
6.0
1.2
1.0
5.0
1.0
4.0
-
3.0
(1.0)
(0.3)
Source: CSO, Angel Research
Source: MOSPI, Angel Research
Exhibit 3: Monthly CPI inflation trends
Exhibit 4: Manufacturing and services PMI
56.0
Mfg. PMI
Services PMI
(%)
6.0
54.0
4.9
52.0
5.0
3.9
50.0
4.0
3.7
3.6
3.4
3.3
3.3
3.2
3.0
48.0
3.0
2.4
2.2
46.0
2.0
1.5
44.0
1.0
42.0
40.0
-
Source: Market, Angel Research; Note: Level above 50 indicates expansion
Source: MOSPI, Angel Research
Exhibit 5: Exports and imports growth trends
Exhibit 6: Key policy rates
(%)
Exports yoy growth
Imports yoy growth
(%)
Repo rate
Reverse Repo rate
CRR
60.0
6.50
50.0
6.00
40.0
5.50
30.0
5.00
20.0
4.50
10.0
4.00
0.0
3.50
(10.0)
3.00
Source: Bloomberg, Angel Research
Source: RBI, Angel Research
Market Outlook
December 22, 2017
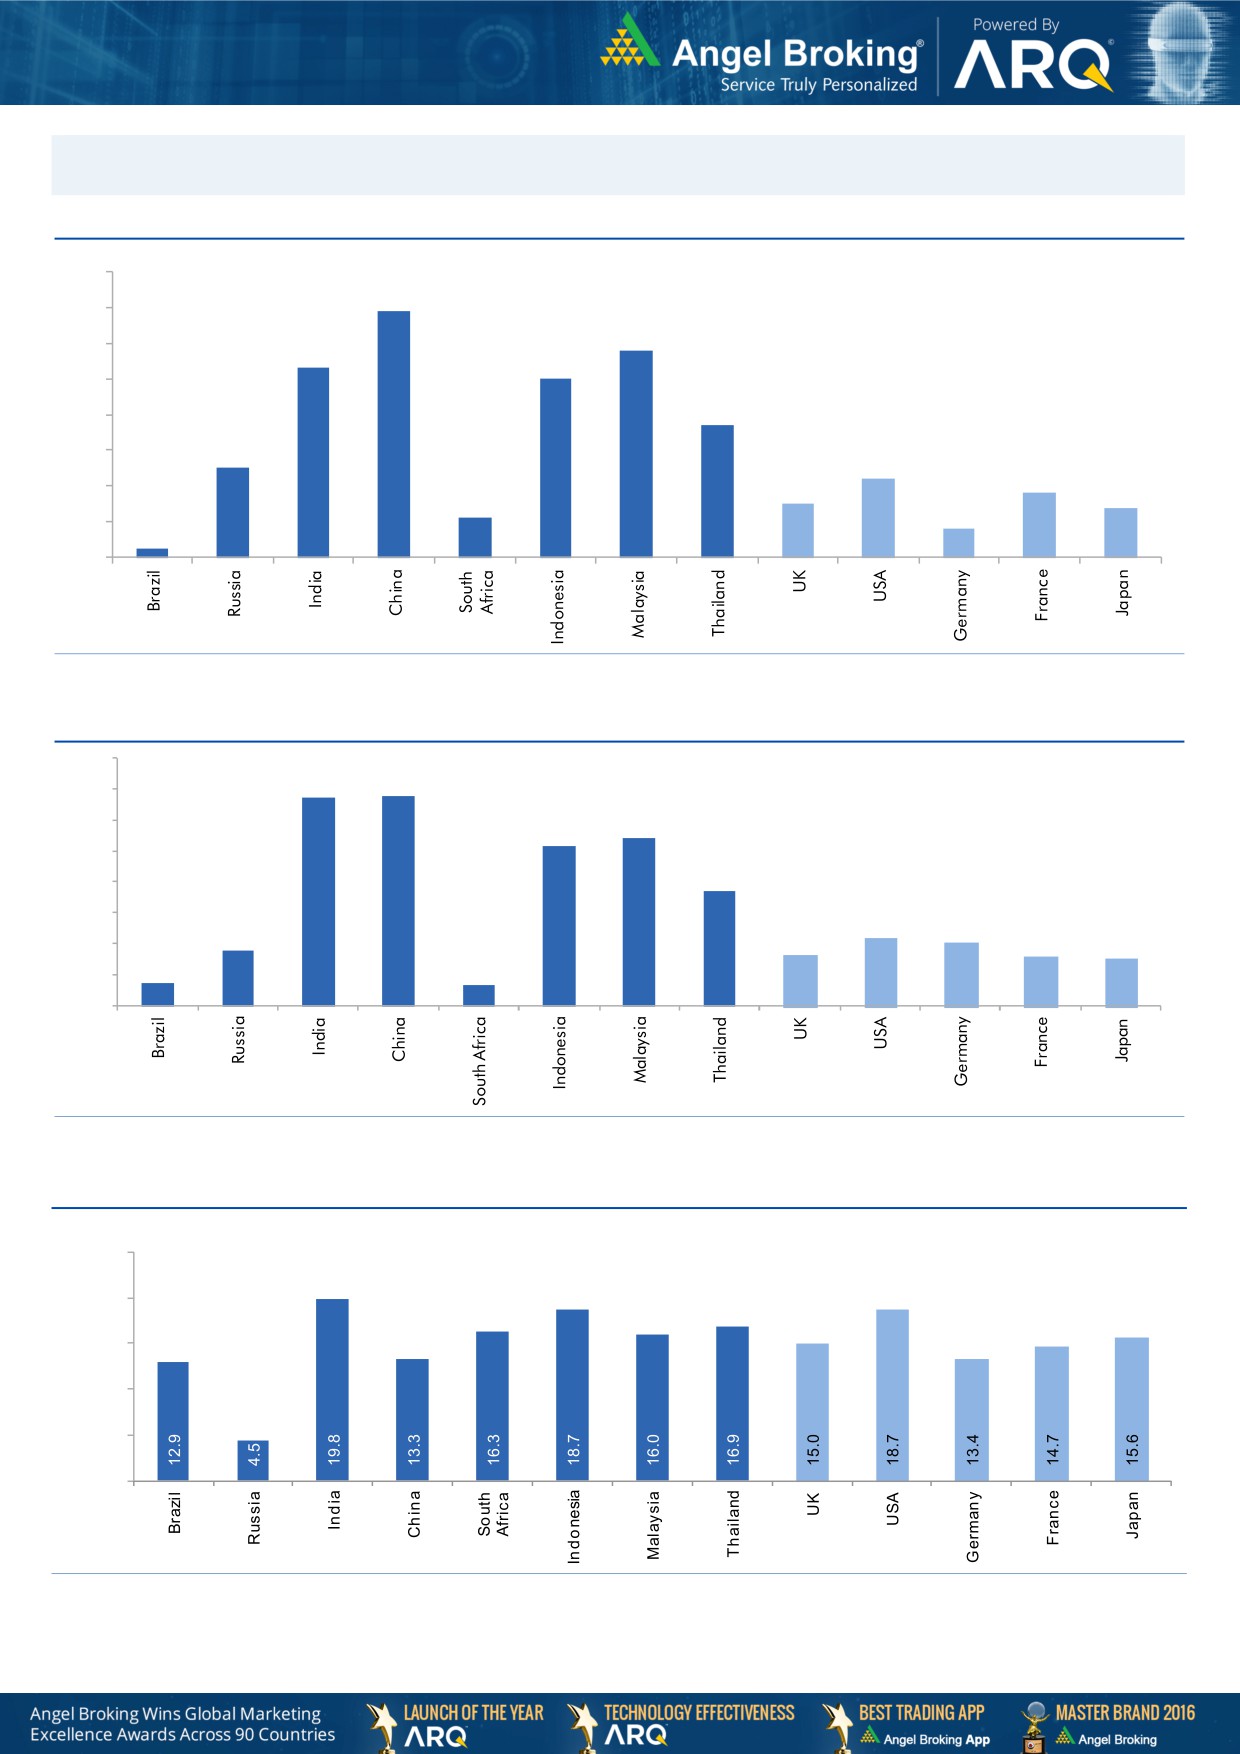
Global watch
Exhibit 1: Latest quarterly GDP Growth (%, yoy) across select developing and developed countries
(%)
8.0
6.9
7.0
5.8
6.0
5.3
5.0
5.0
1.1
3.7
4.0
2.5
3.0
2.2
1.8
2.0
1.5
1.4
0.8
1.0
0.3
-
Source: Bloomberg, Angel Research
Exhibit 2: 2017 GDP Growth projection by IMF (%, yoy) across select developing and developed countries
(%)
6.7
6.8
7.0
6.0
5.4
5.2
5.0
3.7
4.0
3.0
1.8
2.2
2.0
1.7
1.6
2.0
0.7
1.5
0.7
1.0
-
Source: IMF, Angel Research
Exhibit 3: One year forward P-E ratio across select developing and developed countries
(x)
25.0
20.0
15.0
10.0
5.0
-
Source: IMF, Angel Research
Market Outlook
December 22, 2017
Exhibit 4: Relative performance of indices across globe
Returns (%)
Country
Name of index
Closing price
1M
3M
1YR
Brazil
Bovespa
75,133
(0.1)
(3.2)
25.6
Russia
Micex
2,093
(3.1)
1.4
(3.8)
India
Nifty
10,440
1.1
2.9
29.2
China
Shanghai Composite
3,300
(3.2)
(1.6)
4.6
South Africa
Top 40
52,082
(5.4)
5.2
19.1
Mexico
Mexbol
48,503
1.3
(3.7)
7.5
Indonesia
LQ45
1,045
3.3
6.2
18.0
Malaysia
KLCI
1,751
1.9
(1.4)
6.4
Thailand
SET 50
1,125
3.2
5.7
17.5
USA
Dow Jones
24,782
5.9
10.3
24.0
UK
FTSE
7,604
2.6
4.0
7.6
Japan
Nikkei
22,866
2.7
12.6
18.6
Germany
DAX
13,110
(0.7)
4.0
13.9
France
CAC
5,386
(0.2)
1.4
10.2
Source: Bloomberg, Angel Research p68in4
Market Outlook
December 22, 2017
Exhibit 4: Relative performance of indices across globe
Returns (%)
Country
Name of index
Closing price
1M
3M
1YR
Brazil
Bovespa
73,367
(0.1)
(3.2)
25.6
Russia
Micex
2,103
(3.1)
1.4
(3.8)
India
Nifty
10,444
1.1
2.9
29.2
China
Shanghai Composite
3,288
(3.2)
(1.6)
4.6
South Africa
Top 40
51,269
(5.4)
5.2
19.1
Mexico
Mexbol
48,390
1.3
(3.7)
7.5
Indonesia
LQ45
1,027
3.3
6.2
18.0
Malaysia
KLCI
1,747
1.5
(2.1)
6.4
Thailand
SET 50
1,126
3.2
5.7
17.5
USA
Dow Jones
24,727
5.9
10.3
24.0
UK
FTSE
7,525
1.8
3.6
6.5
Japan
Nikkei
22,892
2.2
15.0
18.9
Germany
DAX
13,069
(0.7)
4.0
13.9
France
CAC
5,353
(0.2)
1.4
10.2
Source: Bloomberg, Angel Research p68in4
Stock Watch
December 22, 2017
Company Name
Reco
CMP
Target
Mkt Cap
Sales ( Čcr )
OPM(%)
EPS (Č)
PER(x)
P/BV(x)
RoE(%)
EV/Sales(x)
(Č)
Price ( Č)
( Č cr )
FY18E FY19E
FY18E
FY19E
FY18E
FY19E
FY18E
FY19E
FY18E
FY19E
FY18E
FY19E
FY18E
FY19E
Agri / Agri Chemical
Rallis
Sell
251
209
4,882
1,873
2,099
15.0
15.0
9.5
10.5
26.4
23.9
4.0
3.6
15.8
16.0
2.6
2.3
United Phosphorus
Accumulate
736
820
37,438
18,922
21,949
18.0
18.5
36.2
45.6
20.3
16.2
4.3
3.5
22.7
23.8
2.1
1.8
Auto & Auto Ancillary
Ashok Leyland
Accumulate
118
127
34,496
23,339
27,240
10.1
10.8
4.7
6.2
25.4
19.0
5.1
4.5
20.0
23.6
1.4
1.2
Bajaj Auto
Neutral
3,301
-
95,524
23,936
27,955
19.5
20.1
142.7
167.3
23.1
19.7
5.0
4.5
21.8
22.8
3.6
3.0
Bharat Forge
Buy
731
875
34,035
7,637
8,755
21.7
23.2
36.1
47.3
20.3
15.5
3.6
3.1
18.5
20.8
4.3
3.7
Eicher Motors
Neutral
30,175
-
82,186
19,043
22,837
19.5
19.9
835.4
1,019.0
36.1
29.6
13.5
10.4
40.9
37.8
4.2
3.4
Gabriel India
Neutral
196
-
2,811
1,782
2,033
9.7
10.2
7.1
8.9
27.6
22.1
5.6
4.7
21.0
22.2
1.5
1.3
Hero Motocorp
Accumulate
3,741
4,129
74,702
32,239
36,878
16.0
15.6
184.4
206.5
20.3
18.1
6.4
5.6
31.3
30.7
2.1
1.8
Jamna Auto Industries Neutral
73
-
2,899
1,441
1,662
14.4
14.8
13.9
17.6
5.2
4.1
1.4
1.2
30.0
31.0
2.1
1.8
Mahindra and Mahindra Neutral
1,542
-
95,838
46,971
53,816
13.6
14.0
67.7
79.8
22.8
19.3
3.3
2.9
15.0
15.9
1.9
1.6
Maruti
Accumulate
9,738
10,619
294,155
79,470
95,208
15.9
17.2
281.7
363.8
34.6
26.8
7.5
6.1
21.7
22.8
3.3
2.7
Minda Industries
Neutral
1,299
-
11,229
4,328
5,084
11.0
11.9
27.3
36.4
47.7
35.7
10.1
7.9
23.1
25.6
2.7
2.3
Motherson Sumi
Neutral
385
-
81,133
55,937
64,445
10.8
11.4
16.9
21.1
22.8
18.3
5.1
5.2
25.2
25.4
1.5
1.2
Tata Motors
Neutral
422
-
121,832
303,167
343,649
11.8
13.8
33.1
54.7
12.8
7.7
2.1
1.7
16.9
23.0
0.5
0.4
TVS Motor
Neutral
778
-
36,983
13,992
16,216
9.0
9.4
17.1
20.3
45.7
38.4
12.1
9.4
29.7
27.7
2.6
2.2
Amara Raja Batteries
Neutral
833
-
14,227
6,140
7,122
14.3
15.6
29.3
39.0
28.4
21.4
4.9
4.1
17.1
19.0
2.3
2.0
Exide Industries
Neutral
215
-
18,267
8,689
9,854
15.1
15.2
9.7
11.0
22.3
19.5
4.0
3.5
15.7
16.1
1.9
1.7
Apollo Tyres
Neutral
260
-
14,870
15,739
17,326
13.3
14.6
20.4
26.7
12.7
9.7
1.5
1.4
20.4
26.7
1.2
1.1
Ceat
Neutral
1,836
-
7,427
6,661
7,717
11.1
14.2
116.2
178.2
15.8
10.3
2.7
2.3
15.2
21.3
1.3
1.1
JK Tyres
Neutral
140
-
3,186
8,318
9,239
16.2
16.4
21.0
27.5
6.7
5.1
1.3
1.1
19.1
20.4
0.8
0.7
Swaraj Engines
Neutral
2,030
-
2,521
788
889
16.4
16.5
71.6
81.0
28.4
25.1
8.2
7.6
29.6
31.0
2.9
2.5
Subros
Neutral
297
-
1,782
1,855
2,135
11.6
11.8
10.3
14.7
29.0
20.3
4.4
3.8
15.8
19.1
1.2
1.0
Capital Goods
BEML
Neutral
1,566
-
6,523
4,286
5,194
7.1
8.2
42.9
58.1
36.5
27.0
3.0
2.7
7.6
8.7
1.6
1.3
Bharat Electronics
Neutral
185
-
45,442
10,258
12,470
19.6
19.5
7.3
8.6
25.3
21.5
0.5
0.4
20.4
21.9
3.9
3.2
Voltas
Neutral
637
-
21,064
6,778
8,004
9.6
11.0
17.1
22.4
37.2
28.4
8.9
7.8
17.7
19.8
2.9
2.4
BHEL
Neutral
90
-
33,134
33,200
39,167
6.8
9.5
6.2
11.2
14.6
8.1
0.7
0.6
4.6
8.0
0.6
0.4
Blue Star
Accumulate
800
867
7,667
5,220
6,207
6.3
6.6
16.8
22.3
47.6
35.9
9.5
8.4
19.9
23.3
1.4
1.2
CG Power and Industrial
Neutral
88
-
5,512
6,555
7,292
7.5
7.5
-
0.8
8,795.0
109.9
1.4
1.4
0.1
1.2
1.0
0.9
Solutions
Greaves Cotton
Neutral
114
-
2,793
1,778
1,993
14.7
15.1
8.1
9.1
14.1
12.6
3.2
3.0
21.8
23.6
1.4
1.3
Stock Watch
December 22, 2017
Company Name
Reco
CMP
Target
Mkt Cap
Sales ( Čcr )
OPM(%)
EPS (Č)
PER(x)
P/BV(x)
RoE(%)
EV/Sales(x)
(Č)
Price ( Č)
( Č cr )
FY18E FY19E
FY18E
FY19E
FY18E
FY19E
FY18E
FY19E
FY18E
FY19E
FY18E
FY19E
FY18E
FY19E
Capital Goods
KEC International
Neutral
369
-
9,483
9,779
11,113
9.4
9.8
14.2
18.2
26.0
20.3
5.0
4.1
21.1
22.1
1.3
1.1
KEI Industries
Buy
357
436
2,794
3,001
3,391
10.0
10.0
13.0
16.1
27.4
22.1
5.0
4.1
18.2
18.7
1.1
1.0
Thermax
Neutral
1,187
-
14,138
4,125
4,747
10.3
10.8
26.7
31.5
44.4
37.7
5.0
4.5
11.2
12.0
3.1
2.7
VATech Wabag
Accumulate
603
681
3,294
3,867
4,126
9.6
10.0
34.9
39.8
17.3
15.1
2.9
2.5
17.7
17.5
0.9
0.8
Cement
ACC
Neutral
1,725
-
32,392
12,255
13,350
13.5
14.3
58.0
66.2
29.7
26.1
3.5
3.3
11.5
12.2
2.6
2.4
Ambuja Cements
Neutral
267
-
53,106
10,250
11,450
17.5
19.0
7.2
8.3
37.2
32.2
2.7
2.5
7.0
7.8
5.0
4.4
India Cements
Neutral
178
-
5,494
6,135
6,750
14.8
15.2
8.5
11.5
21.0
15.5
1.0
1.0
4.8
6.2
1.3
1.1
JK Cement
Neutral
1,070
-
7,479
4,150
4,775
19.2
20.0
49.0
63.5
21.8
16.9
3.5
3.0
17.0
18.5
2.2
1.9
J K Lakshmi Cement
Neutral
459
-
5,397
3,422
3,757
15.5
17.0
13.5
23.2
34.0
19.8
3.5
3.0
10.8
15.5
2.0
1.7
Orient Cement
Neutral
166
-
3,408
2,215
3,233
16.8
17.0
5.9
6.9
28.2
24.1
2.2
2.0
10.8
10.1
2.5
1.7
UltraTech Cement
Neutral
4,343
-
119,226
28,250
35,150
20.2
23.5
77.5
122.2
56.0
35.5
4.7
4.3
9.6
14.8
4.7
3.8
Construction
KNR Constructions
Neutral
274
-
3,848
1,846
2,203
14.5
14.5
12.1
13.7
22.6
20.1
1.2
1.1
17.5
16.7
2.4
2.0
Larsen & Toubro
Neutral
1,230
-
172,348
95,787
109,476
10.2
11.6
44.5
50.8
27.7
24.2
3.5
3.2
12.9
13.1
2.4
2.1
Gujarat Pipavav Port
Neutral
136
-
6,563
739
842
61.6
62.7
5.1
6.2
26.6
22.1
3.3
3.2
12.7
14.9
8.5
7.4
PNC Infratech
Neutral
196
-
5,023
2,040
2,935
13.0
13.0
6.4
9.0
30.6
21.8
0.8
0.7
9.7
12.2
2.5
1.8
Simplex Infra
Neutral
582
-
2,878
6,012
6,619
11.6
11.7
21.1
31.0
27.6
18.8
1.9
1.8
6.5
8.6
1.0
0.9
Sadbhav Engineering
Neutral
399
-
6,838
3,823
4,426
10.7
10.8
10.3
11.8
38.7
33.8
4.6
4.1
10.1
10.5
2.1
1.8
NBCC
Neutral
252
-
22,698
9,099
12,706
6.4
6.4
7.3
9.6
34.6
26.4
1.5
1.2
27.5
30.5
2.4
1.7
MEP Infra
Neutral
96
-
1,566
2,403
2,910
18.3
16.8
2.4
6.1
40.9
15.9
15.5
10.5
35.2
55.8
1.8
1.5
SIPL
Neutral
146
-
5,141
2,060
2,390
46.8
47.7
(5.8)
(3.1)
5.5
6.2
(14.2)
(2.3)
7.3
6.7
Engineers India
Neutral
191
-
12,901
1,795
2,611
21.1
22.4
5.9
8.1
32.5
23.6
2.3
2.2
12.9
16.1
5.6
3.7
Financials
Axis Bank
Accumulate
555
580
133,096
32,558
35,843
3.5
3.2
27.8
41.0
20.0
13.5
2.2
1.9
11.4
14.9
-
-
Bank of Baroda
Neutral
167
-
38,387
22,533
26,079
2.4
2.4
12.0
20.9
13.9
8.0
0.9
0.9
6.6
11.0
-
-
Canara Bank
Neutral
365
-
21,825
17,925
20,235
2.0
2.1
18.5
36.5
19.8
10.0
0.8
0.7
3.4
6.2
-
-
Can Fin Homes
Neutral
509
-
6,779
586
741
3.5
3.5
107.8
141.0
4.7
3.6
1.0
0.8
24.1
25.6
-
-
Cholamandalam Inv. &
Neutral
1,297
-
20,265
2,826
3,307
6.3
6.3
53.7
64.6
24.2
20.1
4.1
3.5
18.3
18.9
-
-
Fin. Co.
Dewan Housing Finance Buy
601
712
18,832
2,676
3,383
2.4
2.7
37.4
49.7
16.1
12.1
2.1
1.8
13.8
16.2
-
-
Equitas Holdings
Buy
146
235
4,947
1,125
1,380
9.6
9.8
1.5
6.0
97.1
24.3
2.2
2.1
2.4
8.2
-
-
Federal Bank
Buy
108
125
21,285
4,896
5,930
2.8
3.1
5.4
7.6
20.2
14.3
1.7
1.6
8.5
11.0
-
-
Stock Watch
December 22, 2017
Company Name
Reco
CMP
Target
Mkt Cap
Sales ( Čcr )
OPM(%)
EPS (Č)
PER(x)
P/BV(x)
RoE(%)
EV/Sales(x)
(Č)
Price ( Č)
( Č cr )
FY18E FY19E
FY18E
FY19E
FY18E
FY19E
FY18E
FY19E
FY18E
FY19E
FY18E
FY19E
FY18E
FY19E
Financials
GIC Housing
Buy
420
655
2,263
376
477
3.6
3.7
33.0
40.0
12.7
10.5
2.3
1.9
20.0
23.0
-
-
HDFC Bank
Neutral
1,870
-
483,968
55,236
63,253
4.5
4.4
68.9
82.4
27.2
22.7
4.7
3.9
18.7
18.5
-
-
ICICI Bank
Neutral
316
-
202,695
42,361
51,378
3.6
3.9
18.4
25.7
17.2
12.3
1.9
1.8
11.3
15.0
-
-
Karur Vysya Bank
Buy
125
180
9,010
3,289
3,630
3.7
3.9
10.8
14.1
11.5
8.9
1.4
1.2
12.5
14.7
-
-
LIC Housing Finance
Accumulate
569
630
28,728
4,895
6,332
3.4
3.7
50.7
66.8
11.2
8.5
2.2
1.9
21.7
23.8
-
-
Punjab Natl.Bank
Neutral
171
-
36,303
23,708
25,758
2.1
2.1
5.9
16.4
29.0
10.4
0.9
0.8
3.0
8.3
-
-
RBL Bank
Neutral
516
-
21,511
2,309
2,888
2.6
2.5
16.4
19.1
31.6
27.1
4.0
3.5
13.3
13.8
-
-
Repco Home Finance
Buy
691
825
4,322
496
597
4.4
4.2
38.5
48.7
18.0
14.2
3.2
2.7
19.6
20.6
-
-
South Ind.Bank
Neutral
32
-
5,706
3,195
3,567
3.0
3.1
3.0
3.8
10.5
8.3
1.0
0.9
10.5
11.9
-
-
St Bk of India
Neutral
317
-
273,852
105,827
121,056
2.4
2.5
16.1
25.6
19.7
12.4
1.6
1.4
6.6
9.9
-
-
Union Bank
Neutral
148
-
10,769
14,650
16,225
2.3
2.3
23.1
32.5
6.4
4.6
0.5
0.4
7.1
9.2
-
-
Yes Bank
Neutral
312
-
71,582
11,088
13,138
3.0
2.9
84.0
99.3
3.7
3.1
0.6
0.5
16.3
16.8
-
-
FMCG
Akzo Nobel India
Neutral
1,795
-
8,611
3,164
3,607
13.8
13.7
58.6
67.9
30.6
26.4
7.5
6.6
24.5
25.1
2.6
2.2
Asian Paints
Neutral
1,134
-
108,807
17,603
20,615
18.6
18.6
2,128.9
2,543.3
0.5
0.5
11.2
9.5
28.0
28.9
6.0
5.0
Britannia
Neutral
4,738
-
56,885
9,690
11,278
14.8
15.4
84.0
101.0
56.4
46.9
20.6
16.3
40.6
39.0
5.8
5.0
Colgate
Neutral
1,083
-
29,442
4,420
5,074
24.9
25.3
28.6
32.8
37.9
33.0
14.9
12.1
43.8
40.5
6.5
5.6
Dabur India
Neutral
352
-
61,979
8,346
9,344
19.6
19.9
7.8
9.0
45.1
39.1
9.1
8.2
25.2
24.8
7.0
6.2
GlaxoSmith Con*
Neutral
6,502
-
27,344
5,072
5,760
18.2
18.4
176.3
199.2
36.9
32.6
7.8
7.1
21.2
21.7
4.8
4.2
Godrej Consumer
Neutral
985
-
67,097
10,171
11,682
20.8
21.5
21.7
27.1
45.4
36.3
10.2
8.8
22.3
23.4
6.7
5.8
HUL
Neutral
1,361
-
294,661
37,077
41,508
20.3
21.8
5,189.9
6,318.5
0.3
0.2
41.5
35.5
74.8
82.0
7.7
6.9
ITC
Neutral
263
-
320,916
44,588
49,853
37.0
37.3
9.6
11.0
27.4
23.9
6.7
6.4
25.1
27.3
6.7
5.9
Marico
Neutral
318
-
41,027
6,788
7,766
18.5
19.2
7.1
8.5
44.8
37.4
15.7
13.4
36.9
38.0
5.9
5.1
Nestle*
Neutral
7,951
-
76,659
10,083
11,182
20.0
20.9
119.7
141.3
66.4
56.3
234.1
214.0
36.7
39.8
7.2
6.5
Tata Global
Neutral
301
-
18,984
7,121
7,641
11.9
12.3
6.9
8.0
43.6
37.6
2.9
2.8
6.8
7.2
2.5
2.3
Procter & Gamble
Neutral
9,447
-
30,666
3,034
3,579
27.1
27.7
167.7
198.8
56.3
47.5
15.1
13.0
28.8
29.5
9.5
8.0
Hygiene
IT
HCL Tech^
Accumulate
871
1,014
124,269
50,009
54,608
22.1
22.1
62.8
67.6
13.9
12.9
3.1
2.7
22.4
20.6
2.2
1.9
Infosys
Accumulate
1,013
1,120
232,754
70,333
75,960
26.0
26.0
61.7
65.9
16.4
15.4
3.1
2.9
18.9
18.7
2.7
2.5
TCS
Reduce
2,588
2,442
495,418
123,384
134,488
26.1
26.1
133.2
143.7
19.4
18.0
5.4
5.0
27.6
27.8
3.7
3.3
Tech Mahindra
Accumulate
493
526
48,142
30,545
32,988
15.0
15.0
35.2
37.6
14.0
13.1
2.4
2.2
16.8
16.2
1.4
1.2
Stock Watch
December 22, 2017
Company Name
Reco
CMP
Target
Mkt Cap
Sales ( Čcr )
OPM(%)
EPS (Č)
PER(x)
P/BV(x)
RoE(%)
EV/Sales(x)
(Č)
Price ( Č)
( Č cr )
FY18E FY19E
FY18E
FY19E
FY18E
FY19E
FY18E
FY19E
FY18E
FY19E
FY18E
FY19E
FY18E
FY19E
IT
Wipro
Neutral
297
-
144,370
54,164
56,544
22.3
22.3
18.8
19.5
15.8
15.2
2.5
2.2
15.0
13.6
1.9
1.7
Media
D B Corp
Neutral
343
-
6,318
2,404
2,625
30.5
31.5
23.7
26.9
14.5
12.8
3.4
2.9
23.5
22.8
2.4
2.2
HT Media
Neutral
98
-
2,269
2,589
2,830
15.1
15.4
8.3
10.9
11.8
8.9
1.0
0.9
8.4
10.4
0.4
0.3
Jagran Prakashan
Buy
166
225
5,173
2,541
2,835
28.5
28.7
12.7
14.1
13.1
11.8
2.7
2.4
21.3
21.4
1.9
1.6
Sun TV Network
Neutral
940
-
37,034
3,238
3,789
51.9
55.1
30.9
38.0
30.4
24.7
8.7
7.6
30.0
31.0
11.5
9.7
Hindustan Media
Neutral
241
-
1,770
1,002
1,074
23.3
23.5
29.2
33.8
8.3
7.1
1.3
1.1
15.6
15.4
0.8
0.5
Ventures
TV Today Network
Accumulate
411
435
2,450
667
727
27.7
27.7
18.6
20.1
22.1
20.5
3.4
3.5
15.6
17.3
3.2
3.0
Music Broadcast Limited Accumulate
380
434
2,170
271
317
91.0
109.0
6.0
10.0
63.4
38.0
4.0
3.6
6.5
9.3
7.6
6.3
Metals & Mining
Coal India
Neutral
270
-
167,352
82,301
91,235
17.0
18.0
17.1
20.5
15.8
13.2
3.0
2.8
45.0
55.0
1.7
1.5
Hind. Zinc
Neutral
303
-
128,217
22,108
24,555
57.0
58.0
22.1
26.3
13.7
11.5
4.5
3.6
32.0
35.0
4.8
4.0
Hindalco
Neutral
259
-
58,042
102,350
105,355
13.5
14.5
21.5
24.5
12.0
10.6
1.7
1.4
15.0
15.2
1.2
1.1
JSW Steel
Neutral
263
-
63,476
64,500
68,245
21.1
21.5
20.1
21.2
13.1
12.4
2.4
2.1
-
-
1.7
1.6
NMDC
Neutral
135
-
42,839
10,209
11,450
47.0
48.0
11.1
12.1
12.2
11.2
1.7
1.6
-
-
3.7
3.3
SAIL
Neutral
85
-
34,920
54,100
63,555
3.0
10.0
(10.0)
1.5
56.4
1.1
1.1
-
-
1.7
1.4
Vedanta
Neutral
317
-
117,928
81,206
87,345
28.0
29.0
26.5
33.5
12.0
9.5
2.7
2.3
-
-
2.2
1.9
Tata Steel
Neutral
703
-
68,233
121,445
126,500
16.2
17.2
65.4
81.3
10.7
8.7
1.7
1.5
-
-
1.1
1.0
Oil & Gas
GAIL
Neutral
500
-
84,557
53,115
52,344
14.2
15.3
30.0
31.1
16.7
16.1
2.1
1.9
-
-
1.3
1.3
ONGC
Neutral
188
-
241,137
83,111
84,934
44.2
44.9
16.4
16.9
11.5
11.1
1.4
1.3
-
-
2.8
2.7
Indian Oil Corp
Neutral
410
-
199,141
396,116
432,560
8.5
8.8
40.1
42.2
10.2
9.7
1.8
1.6
-
-
0.6
0.6
Reliance Industries
Neutral
919
-
597,537
257,711
267,438
17.0
18.2
89.1
89.5
10.3
10.3
1.0
0.9
-
-
2.0
1.9
Pharmaceuticals
Alembic Pharma
Accumulate
529
600
9,965
3,346
3,915
19.6
19.2
21.0
23.9
25.2
22.1
4.4
3.8
19.1
18.4
3.0
2.6
Alkem Laboratories Ltd
Accumulate
2,169
2,341
25,932
6,320
7,341
17.5
19.8
72.7
96.6
29.8
22.5
5.3
4.5
16.7
18.7
4.0
3.4
Aurobindo Pharma
Buy
687
823
40,259
17,086
19,478
22.1
22.0
44.7
51.4
15.4
13.4
3.4
2.8
24.7
22.7
2.5
2.1
Aventis*
Neutral
4,630
-
10,664
2,411
2,698
18.8
18.8
151.6
163.9
30.5
28.3
4.7
3.8
25.4
27.5
4.1
3.4
Cadila Healthcare
Neutral
420
-
42,997
11,365
12,926
20.0
20.0
18.4
20.5
22.8
20.5
5.0
4.2
24.3
22.2
3.9
3.4
Cipla
Sell
599
462
48,208
16,163
18,711
16.6
16.9
20.7
24.3
28.9
24.7
3.4
3.1
12.6
13.1
3.1
2.7
Dr Reddy's
Reduce
2,356
2,040
39,075
13,734
15,548
17.7
20.2
69.9
102.0
33.7
23.1
3.0
2.7
9.2
12.4
3.1
2.7
GSK Pharma*
Sell
2,413
2,000
20,438
2,968
3,324
13.8
15.9
37.8
46.3
63.8
52.1
11.2
12.3
16.7
22.4
6.8
6.2
Indoco Remedies
Sell
288
136
2,649
1,114
1,297
9.9
13.9
5.6
11.4
51.3
25.2
3.9
3.5
7.7
14.5
2.7
2.2
Stock Watch
December 22, 2017
Company Name
Reco
CMP
Target
Mkt Cap
Sales ( Čcr )
OPM(%)
EPS (Č)
PER(x)
P/BV(x)
RoE(%)
EV/Sales(x)
(Č)
Price ( Č)
( Č cr )
FY18E FY19E
FY18E
FY19E
FY18E
FY19E
FY18E
FY19E
FY18E
FY19E
FY18E
FY19E
FY18E
FY19E
Pharmaceuticals
Ipca labs
Neutral
573
-
7,226
3,256
3,647
14.1
17.1
16.2
25.4
35.4
22.6
2.7
2.5
8.0
11.5
2.4
2.1
Lupin
Buy
875
1,091
39,549
16,240
18,562
21.3
21.7
42.5
49.6
20.6
17.6
2.6
2.3
13.3
13.7
2.5
2.2
Natco Pharma
Accumulate
971
1,057
17,910
1,886
2,016
32.3
29.5
23.2
22.0
41.9
44.0
8.8
7.8
20.9
17.6
9.4
8.7
Sun Pharma
Buy
527
615
126,476
28,312
31,826
20.7
22.4
18.5
22.3
28.5
23.6
3.2
2.9
11.5
14.0
4.1
3.6
Syngene International
Accumulate
537
587
10,745
1,394
1,818
33.0
36.5
15.8
21.0
34.0
25.6
6.3
5.2
18.6
20.3
7.7
5.9
Power
Tata Power
Neutral
91
-
24,573
32,547
33,806
20.5
20.5
4.7
5.4
19.3
17.0
1.8
1.6
10.5
10.5
1.7
1.7
NTPC
Neutral
179
-
147,223
86,070
101,246
28.3
30.7
12.9
16.2
13.8
11.0
1.4
1.3
10.6
12.4
3.1
2.8
Power Grid
Accumulate
203
223
106,227
29,183
32,946
89.7
90.0
18.0
20.8
11.3
9.8
1.9
1.7
17.7
18.2
7.6
7.0
Real Estate
Prestige Estate
Neutral
302
-
11,331
4,607
5,146
21.0
22.2
7.9
9.8
38.3
30.8
2.4
2.2
10.3
12.0
3.6
3.3
MLIFE
Accumulate
465
522
2,384
487
590
12.3
17.8
21.0
31.2
22.1
14.9
1.2
1.1
5.2
7.4
3.6
3.0
Telecom
Bharti Airtel
Neutral
529
-
211,303
97,903
105,233
36.0
36.3
9.3
11.1
56.8
47.8
2.8
2.6
5.0
5.6
3.1
2.8
Idea Cellular
Neutral
98
-
35,370
35,012
37,689
27.1
27.7
(4.4)
(2.7)
1.5
1.6
(6.8)
(4.6)
2.4
2.1
Others
Abbott India
Neutral
5,564
-
11,824
3,244
3,723
14.9
16.1
167.5
209.4
33.2
26.6
7.3
6.1
23.7
24.8
3.3
2.8
Asian Granito
Accumulate
539
570
1,623
1,169
1,286
12.5
12.5
16.0
19.7
33.8
27.4
3.6
3.2
10.7
11.6
1.6
1.4
Bajaj Electricals
Neutral
483
-
4,907
4,646
5,301
6.7
7.6
16.1
22.3
30.0
21.6
4.9
4.2
16.4
19.2
1.0
0.9
Banco Products (India)
Neutral
257
-
1,836
1,530
1,695
13.2
12.7
19.0
20.0
13.5
12.8
2.2
1.9
0.2
0.2
1.1
123.9
Coffee Day Enterprises
Neutral
284
-
5,849
3,494
3,913
17.4
18.0
4.8
5.7
-
49.8
2.5
2.4
-
0.1
2.1
1.9
Ltd
Elecon Engineering
Neutral
111
-
1,240
171
201
15.0
16.2
36.0
43.0
3.1
2.6
0.3
0.2
0.1
0.1
6.4
5.4
Garware Wall Ropes
Neutral
939
-
2,054
928
1,003
15.2
15.2
39.4
43.2
23.8
21.7
3.9
3.4
16.5
15.4
2.1
1.9
Goodyear India*
Neutral
943
-
2,175
1,717
1,866
11.8
12.3
47.9
49.8
19.7
19.0
3.0
2.6
15.6
15.7
1.0
144.9
Hitachi
Neutral
2,615
-
7,110
2,355
2,715
10.3
10.8
49.0
60.9
53.4
42.9
12.5
9.9
0.2
0.2
3.0
2.6
HSIL
Neutral
525
-
3,794
2,240
2,670
14.6
15.0
17.0
22.0
30.9
23.9
2.5
2.4
0.1
0.1
1.9
1.5
Interglobe Aviation
Neutral
1,139
-
43,773
22,570
27,955
14.2
15.0
63.6
81.8
17.9
13.9
9.4
8.0
0.5
0.6
1.6
1.2
Jyothy Laboratories
Neutral
385
-
7,003
1,781
2,044
14.1
15.0
9.4
10.5
41.2
36.7
8.8
8.2
0.2
0.2
4.2
3.6
Linc Pen & Plastics
Neutral
339
-
502
420
462
9.3
9.3
15.3
17.1
22.2
19.8
3.7
3.9
16.9
19.5
1.2
1.1
M M Forgings
Neutral
1,104
-
1,333
542
642
20.1
21.0
41.6
56.8
26.5
19.4
3.7
3.1
0.1
0.2
3.1
2.6
Mirza International
Neutral
160
-
1,928
1,148
1,285
18.0
18.0
8.0
9.4
19.9
17.1
3.3
2.8
16.3
16.1
1.8
1.6
Navkar Corporation
Buy
189
265
2,843
561
617
41.5
41.5
11.5
12.7
16.4
14.9
1.7
1.6
10.5
10.4
5.7
5.0
Nilkamal
Neutral
1,852
-
2,764
2,317
2,525
11.4
11.1
96.0
105.0
19.3
17.6
3.3
2.9
0.2
0.2
1.2
1.1
Stock Watch
December 22, 2017
Company Name
Reco
CMP
Target Mkt Cap
Sales ( Čcr )
OPM(%)
EPS (Č)
PER(x)
P/BV(x)
RoE(%)
EV/Sales(x)
(Č)
Price ( Č)
( Č cr )
FY18E FY19E FY18E FY19E FY18E FY19E FY18E FY19E FY18E FY19E FY18E FY19E FY18E FY19E
Others
Parag Milk Foods
Neutral
297
-
2,502
1,987
2,379
7.6
9.0
12.4
18.3
24.0
16.3
3.4
3.0
8.2
13.2
1.4
1.2
Radico Khaitan
Neutral
279
-
3,720
1,811
1,992
13.2
13.2
8.1
8.8
34.5
31.7
3.5
3.8
10.1
12.0
2.4
2.2
Relaxo Footwears
Neutral
693
-
8,338
1,981
2,310
13.7
14.5
12.0
15.5
57.7
44.7
11.2
9.1
0.2
0.2
4.3
3.6
Siyaram Silk Mills
Accumulate
759
800
3,556
1,769
1,981
12.7
12.7
22.6
26.2
33.5
28.9
5.2
4.5
15.5
15.5
2.1
1.9
Styrolution ABS India* Neutral
1,085
-
1,908
1,800
1,980
8.0
8.1
42.0
46.2
25.8
23.5
2.9
2.6
0.1
0.1
1.2
1.1
Surya Roshni
Neutral
387
-
1,697
4,870
5,320
7.7
7.8
22.8
28.1
17.0
13.8
2.3
2.0
0.1
0.1
0.6
0.5
TVS Srichakra
Neutral
3,345
-
2,562
2,729
2,893
12.7
12.5
248.5
265.0
13.5
12.6
3.8
3.1
0.3
0.3
1.0
0.9
Visaka Industries
Neutral
631
-
1,003
1,104
1,214
12.1
12.6
31.0
37.9
20.4
16.7
2.5
2.2
0.1
0.1
1.1
1.0
VIP Industries
Accumulate
353
400
4,986
1,450
1,693
10.4
10.5
6.5
7.8
53.9
45.2
11.4
10.0
21.1
22.1
3.4
2.9
Navin Fluorine
Neutral
777
-
3,832
945
1,154
17.5
17.9
28.7
34.8
27.1
22.3
4.5
3.8
-
-
3.6
2.8
Source: Company, Angel Research; Note: *December year end; #September year end; &October year end; Price as on December 21, 2017
Market Outlook
December 22, 2017
Research Team Tel: 022 - 39357800
DISCLAIMER
Angel Broking Private Limited (hereinafter referred to as “Angel”) is a registered Member of National Stock Exchange of India
Limited,Bombay Stock Exchange Limited and Metropolitan Stock Exchange Limited. It is also registered as a Depository Participant with
CDSL and Portfolio Manager with SEBI. It also has registration with AMFI as a Mutual Fund Distributor. Angel Broking Private Limited is a
registered entity with SEBI for Research Analyst in terms of SEBI (Research Analyst) Regulations, 2014 vide registration number
INH000000164. Angel or its associates has not been debarred/ suspended by SEBI or any other regulatory authority for accessing
/dealing in securities Market. Angel or its associates/analyst has not received any compensation / managed or
co-managed public offering of securities of the company covered by Analyst during the past twelve months.
This document is solely for the personal information of the recipient, and must not be singularly used as the basis of any investment
decision. Nothing in this document should be construed as investment or financial advice. Each recipient of this document should make
such investigations as they deem necessary to arrive at an independent evaluation of an investment in the securities of the companies
referred to in this document (including the merits and risks involved), and should consult their own advisors to determine the merits and
risks of such an investment.
Reports based on technical and derivative analysis center on studying charts of a stock's price movement, outstanding positions and
trading volume, as opposed to focusing on a company's fundamentals and, as such, may not match with a report on a company's
fundamentals. Investors are advised to refer the Fundamental and Technical Research Reports available on our website to evaluate the
contrary view, if any.
The information in this document has been printed on the basis of publicly available information, internal data and other reliable
sources believed to be true, but we do not represent that it is accurate or complete and it should not be relied on as such, as this
document is for general guidance only. Angel Broking Pvt. Limited or any of its affiliates/ group companies shall not be in any way
responsible for any loss or damage that may arise to any person from any inadvertent error in the information contained in this report.
Angel Broking Pvt. Limited has not independently verified all the information contained within this document. Accordingly, we cannot
testify, nor make any representation or warranty, express or implied, to the accuracy, contents or data contained within this document.
While Angel Broking Pvt. Limited endeavors to update on a reasonable basis the information discussed in this material, there may be
regulatory, compliance, or other reasons that prevent us from doing so.
This document is being supplied to you solely for your information, and its contents, information or data may not be reproduced,
redistributed or passed on, directly or indirectly.
Neither Angel Broking Pvt. Limited, nor its directors, employees or affiliates shall be liable for any loss or damage that may arise from
or in connection with the use of this information.